Jaziel
Flores
Welcome to Jaziel Flores's homepage.
I'm a Data Scientist and data visualisation enthousiast currently
working as Lead Machine Learning Engineer for NTT DATA Europe & LATAM .
Jaziel
Flores
Welcome to Jaziel Flores's homepage.
I'm a Data Scientist and data visualisation enthousiast currently
working as Lead Machine Learning Engineer for NTT DATA Europe & LATAM .

Hi, I'm Jaziel.
My job consists in helping companies and researchers to analyse their datasets, then if it is necessary create an automated solution (model) to take better decisions. I am skilled for most data-science steps: data pre-processing, application of statistical methods, data visualization and results communication.
I'm now working for for NTT DATA Europe & LATAM as Lead Machine Learning Engineer.
Publications Talks Twitter GithubServices
Short talks or multi-day courses on R & Python, data analytics, Phisics & Mathematics and more.
+BLOG
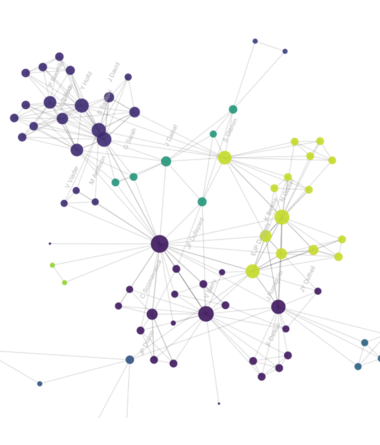
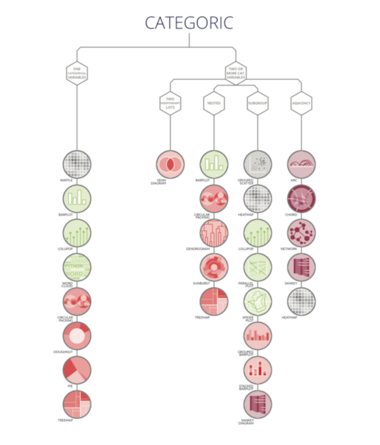
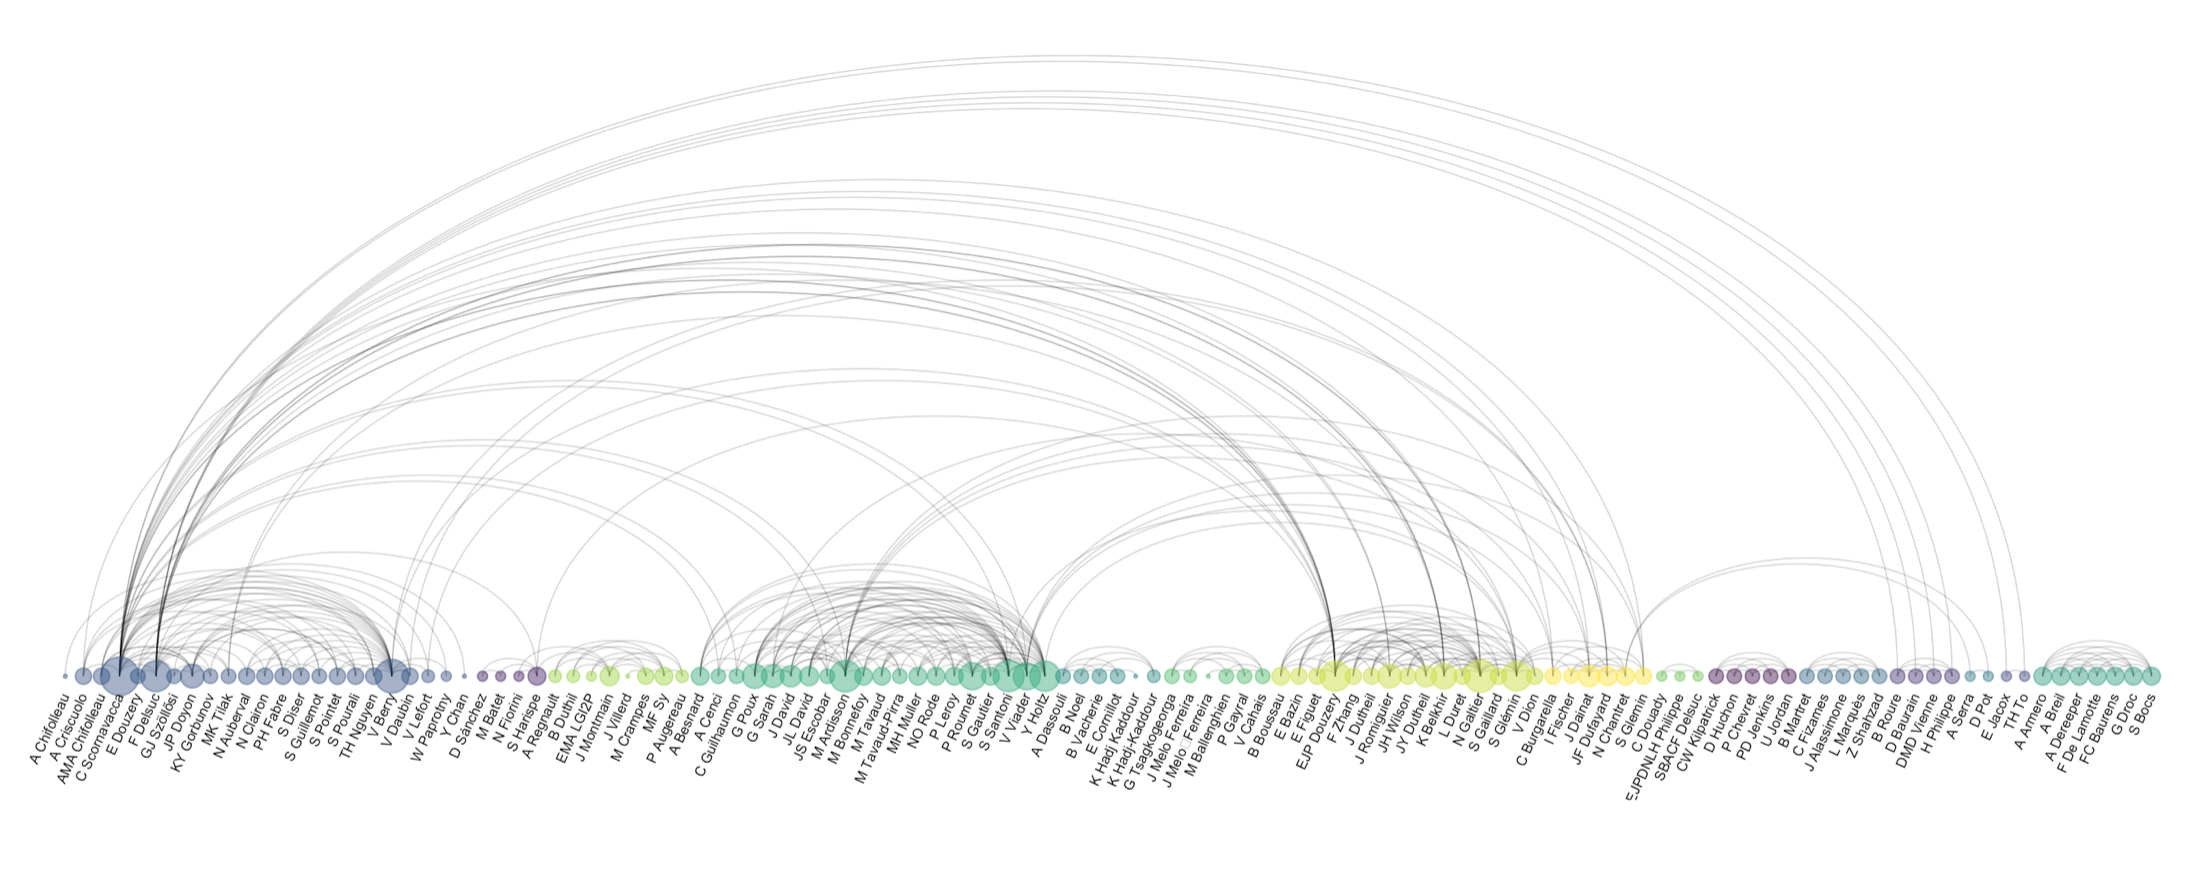
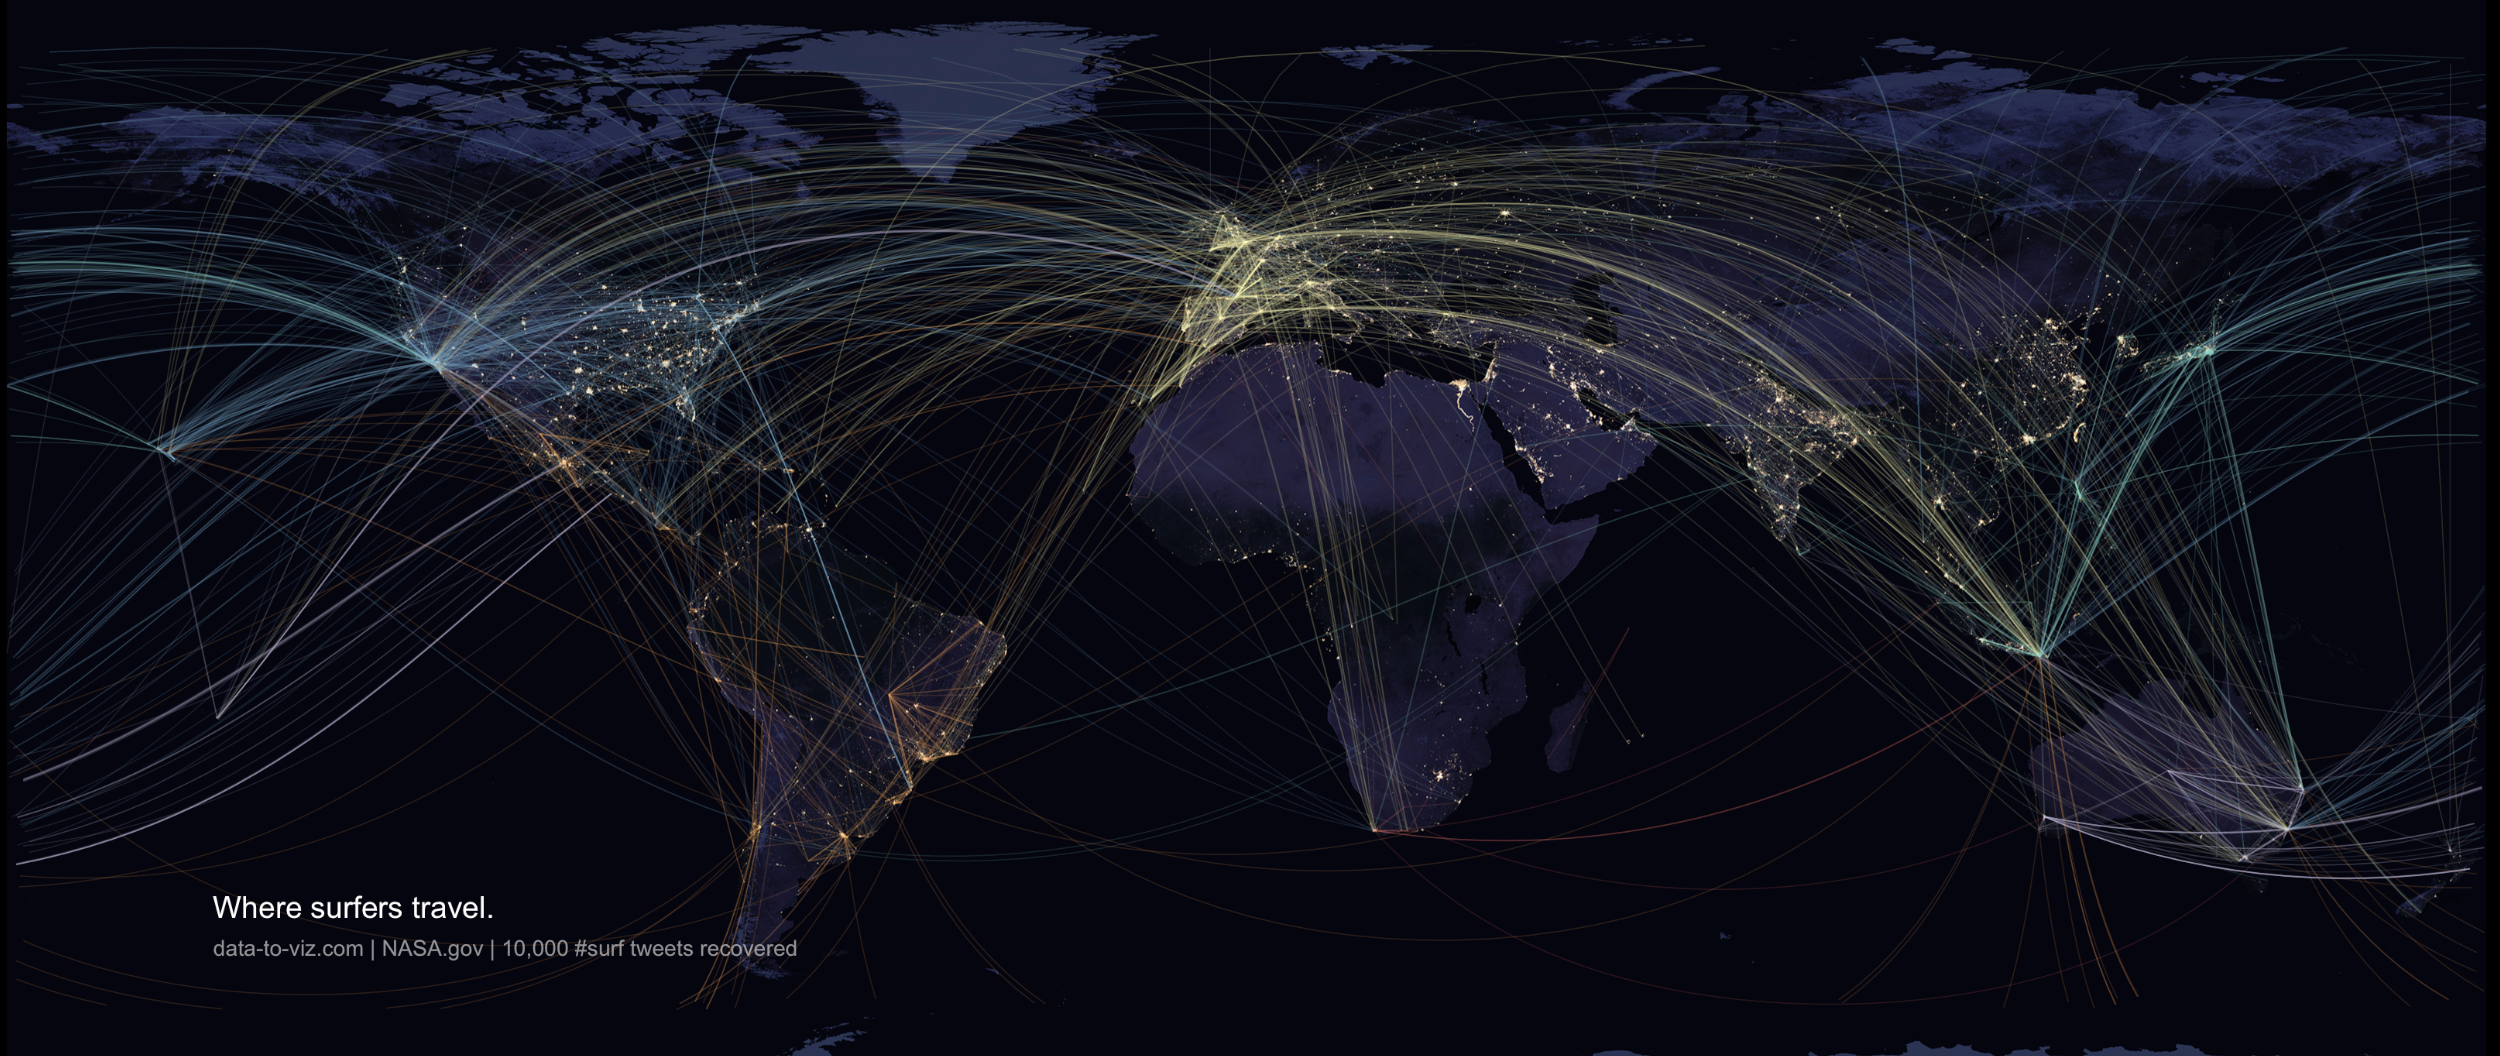
From Data to Viz - A classification of chart types based on input data format
July 2018 - 6 minutes read
I’m delighted to announce a new dataviz project called Data to Viz. It is a classification of chart types based on input data format. It comes in the form of a decision tree leading to a set of potentially appropriate visualizations to represent the dataset. - Read more
Pimp my RMD - A collection of tips for R Markdown
July 2018 - 2 minutes read
R markdown creates interactive reports from R code. I’ve created a document that provides a few tips I use on a daily basis to improve the appearance of my html outputs (my memory aid). This document is built using R Markdown and hosted on Github. - Read more

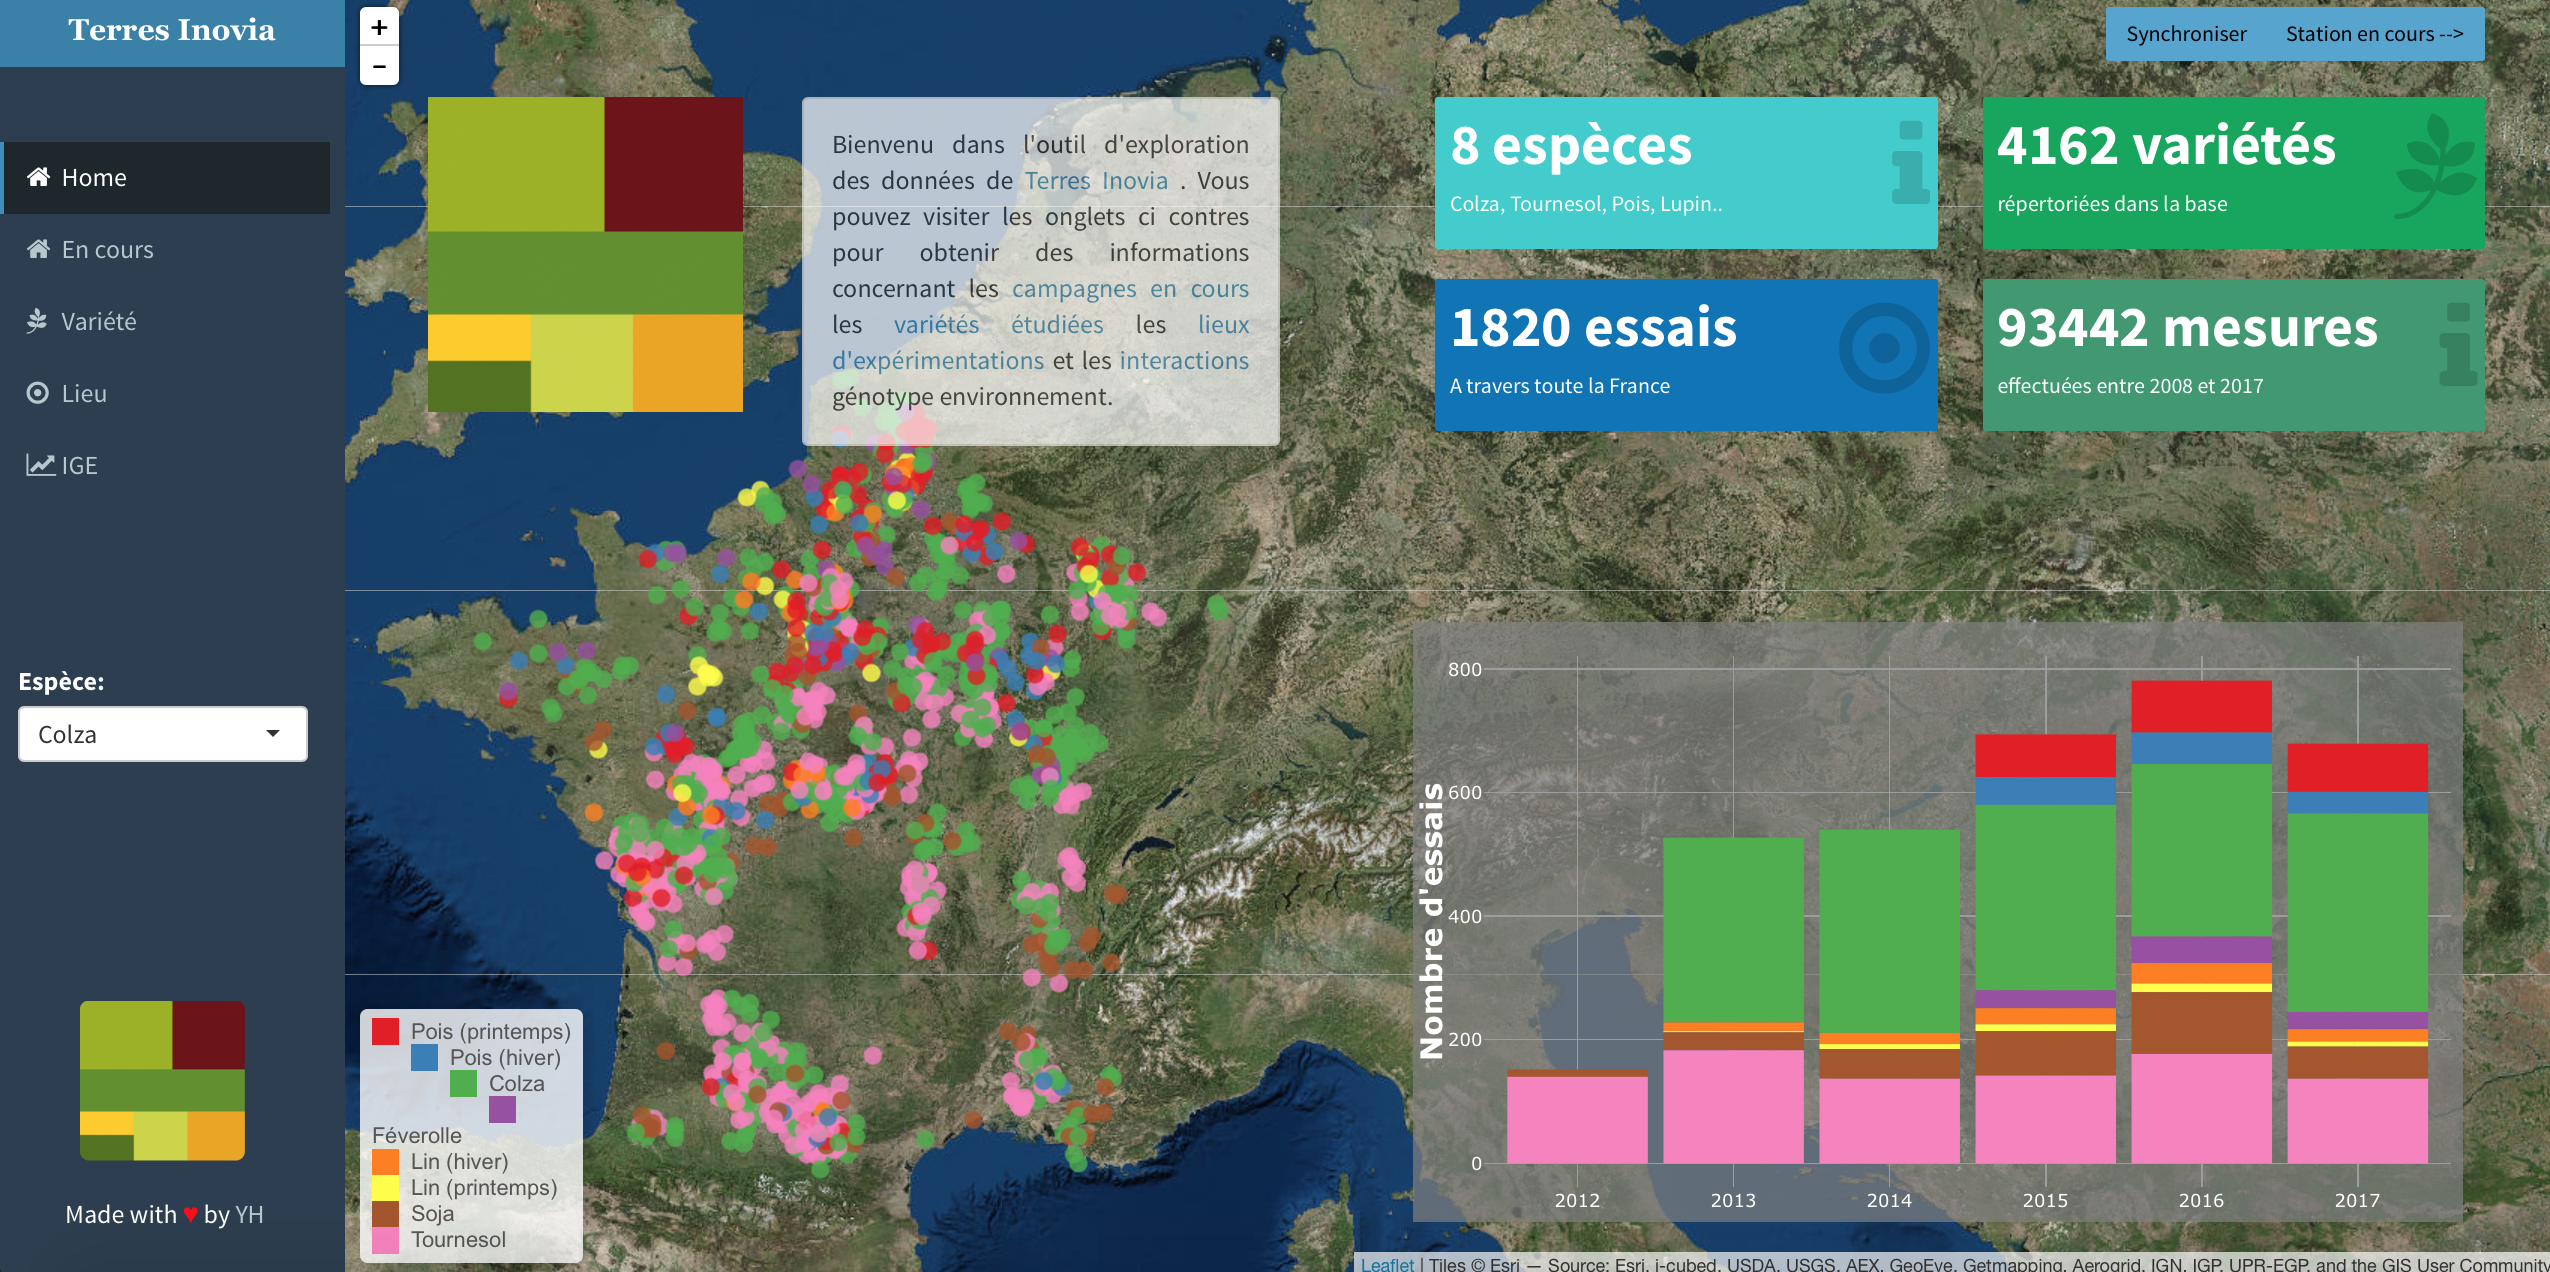
"[...] Yan did an absolutely brilliant job. He has multiple skills and qualities making him a great data science project member, and even leader : excellent knowledge and learning ability of diverse statistical and data management tools obviously, and a real knack for data viz."
D. Gouache - Deputy Director at Terres Inovia

"Yan always performed with outstanding skills and impressive capacity for adaptation and efficiency. His job was crucial for the publication of important results. [...] I thus highly recommend him for any work concering framing and analysis of huge data sets."
J. David - Professor at Montpellier Supagro

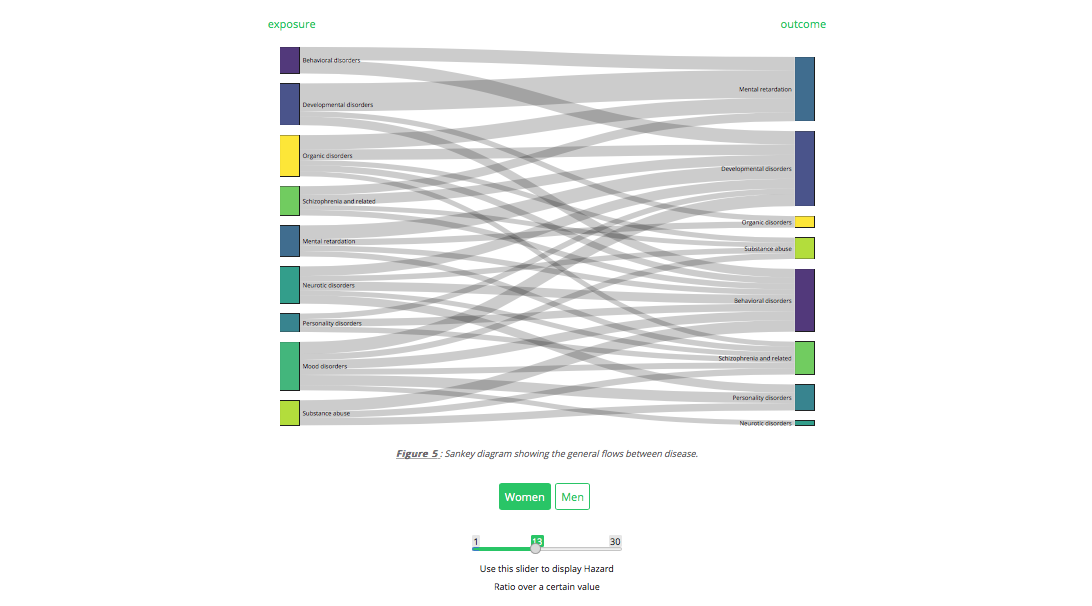
"Yan has taught me everything I know about data visualization!
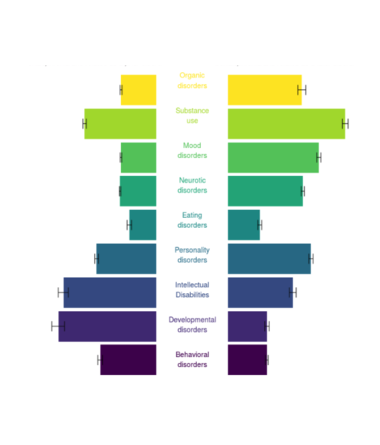
He taught my group how to display data in clever ways, and has been responsible for our recent
interactive website related to psychiatric epidemiology.
Also, he is a super-fast and
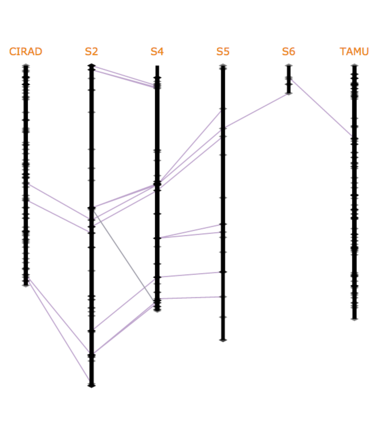
efficient bioinformatician. He has set up a pipeline to handle large genetic datasets and apply
modern analytic methods to explore the genetic architecture of traits and disorders.
He is a
super-bright guy – I can highly recommend him!"
John McGrath - Senior Researcher at the Queensland Brain Institute